

Visual Capitalist: Average S&P 500 Return By Zodiac Year
The Chinese zodiac calendar is a 12-year cycle, where each year is represented by an animal symbolizing different traits and characteristics.
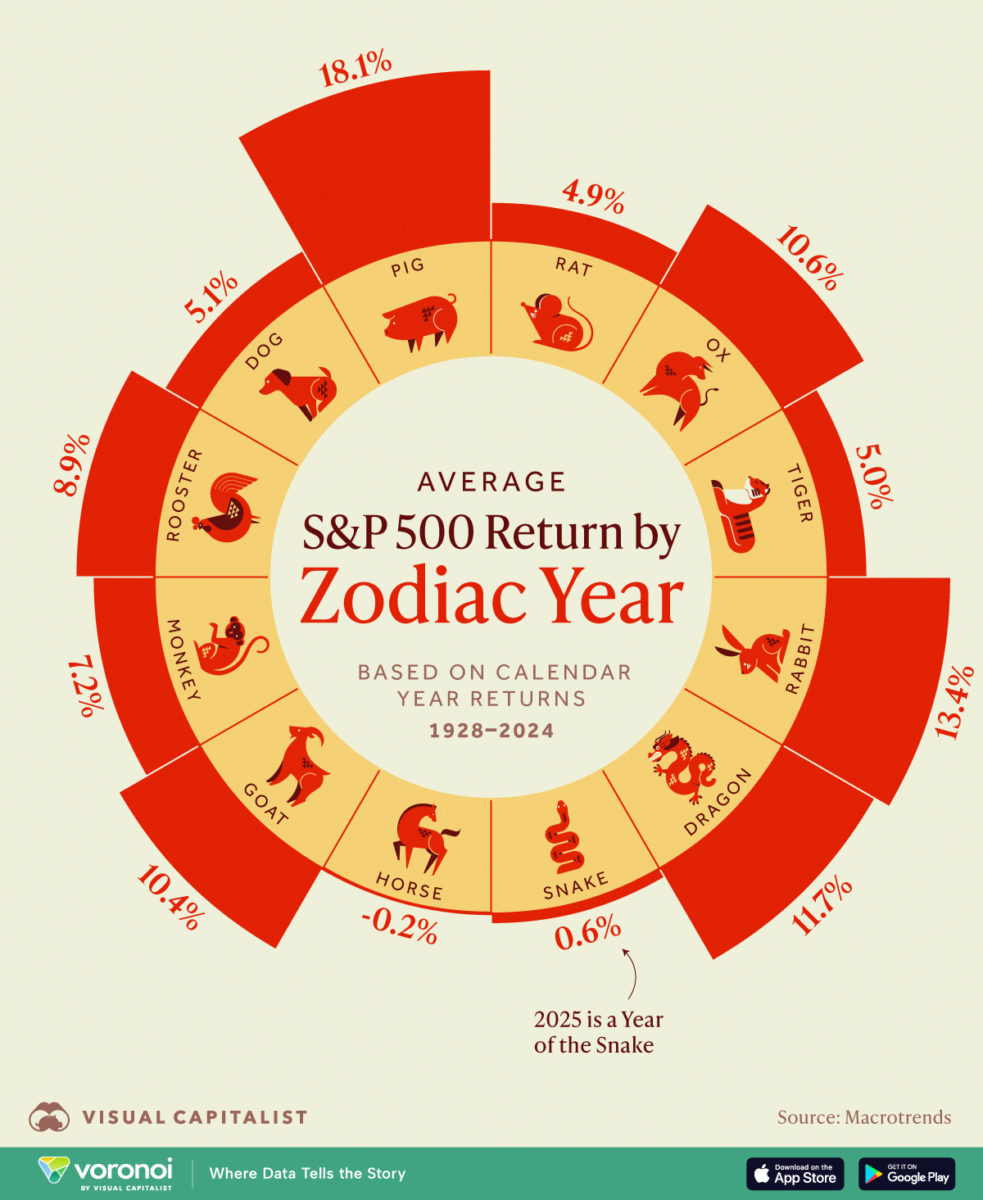
To see if this ancient calendar has any bearing on investment results, we’ve visualized the average S&P 500 return by zodiac year.
This analysis spans 1928 to 2024, and is based on calendar year (Jan-Dec) returns. The Chinese zodiac calendar follows a lunar cycle, meaning its start date varies.
Data and Key Takeaways
To conduct this analysis, we took the annual percentage change of the S&P 500 from 1928 to 2024, using Macrotrends.
Then, we categorized each year according to the Chinese zodiac calendar and calculated the average (mean) return. These results are summarized below:
| Zodiac Year | Average S&P 500 Return (%) |
|---|---|
| 🐖 Pig | 18.1 |
| 🐇 Rabbit | 13.4 |
| 🐉 Dragon | 11.7 |
| 🐂 Ox | 10.6 |
| 🐐 Goat | 10.4 |
| 🐓 Rooster | 8.9 |
| 🐒 Monkey | 7.2 |
| 🐕 Dog | 5.1 |
| 🐅 Tiger | 5.0 |
| 🐀 Rat | 4.9 |
| 🐍 Snake | 0.6 |
| 🐎 Horse | -0.2 |
Oink Oink! 🐷
The Year of the Pig is a symbol of luck, wealth, and fertility—so it’s fitting that these years have also seen the highest average S&P 500 returns.
The most recent Year of the Pig was 2019, in which the S&P 500 climbed an impressive +28.9%.
Other strong pig years were 1935 (+41.4%) and 1995 (34.1%). Unfortunately, the next Year of the Pig won’t be until 2031.
Neigh! 🐴
The Year of the Horse, on the other hand, is the worst-performing zodiac animal. This zodiac year symbolizes power, beauty, and freedom.
The worst horse years for the S&P 500 were 1930 (-28.5%), 2002 (-23.4%), and 1966 (-13.1%).
What About 2025?
2025 is a Year of the Snake, which based on this data, is the second-worst year on average after horse.
This doesn’t mean that 2025 will be a poor year, though. The S&P 500 has seen plenty of ups and downs during snake years, with the four most recent being:
- 2013: +29.6%
- 2001: -13.0%
- 1989: +27.3%
- 1977: -11.5%
Another factor to consider is how the S&P 500 performs by U.S. presidential year, which we covered in a previous graphic.
The Full List
The following table includes the full dataset we used to create this graphic.
Source: https://www.visualcapitalist.com/visualized-average-sp-500-return-by-zodiac-year/