


News & Insights

John Hancock: Weekly Market Recap Week Ended May 2
Resilient labor market U.S. stock indexes rose on Friday after an employment report exceeded most economists’ expectations for the second month in a row. The economy generated 177,000 new jobs in April, above consensus expectations for around 130,000. The unemployment rate held steady at 4.2%. Another upgrade Nearly three-quarters of the way through earnings […]

Global X: Roll With The Changes
This month’s title was the lead track on REO Speedwagon’s 1978 album You Can Tune a Piano, But You Can’t Tuna Fish. It seems oddly descriptive for an economy and financial markets grappling with very high levels of uncertainty. By most indicators, the U.S. economy was quite strong at the start of 2025. Inflation was […]
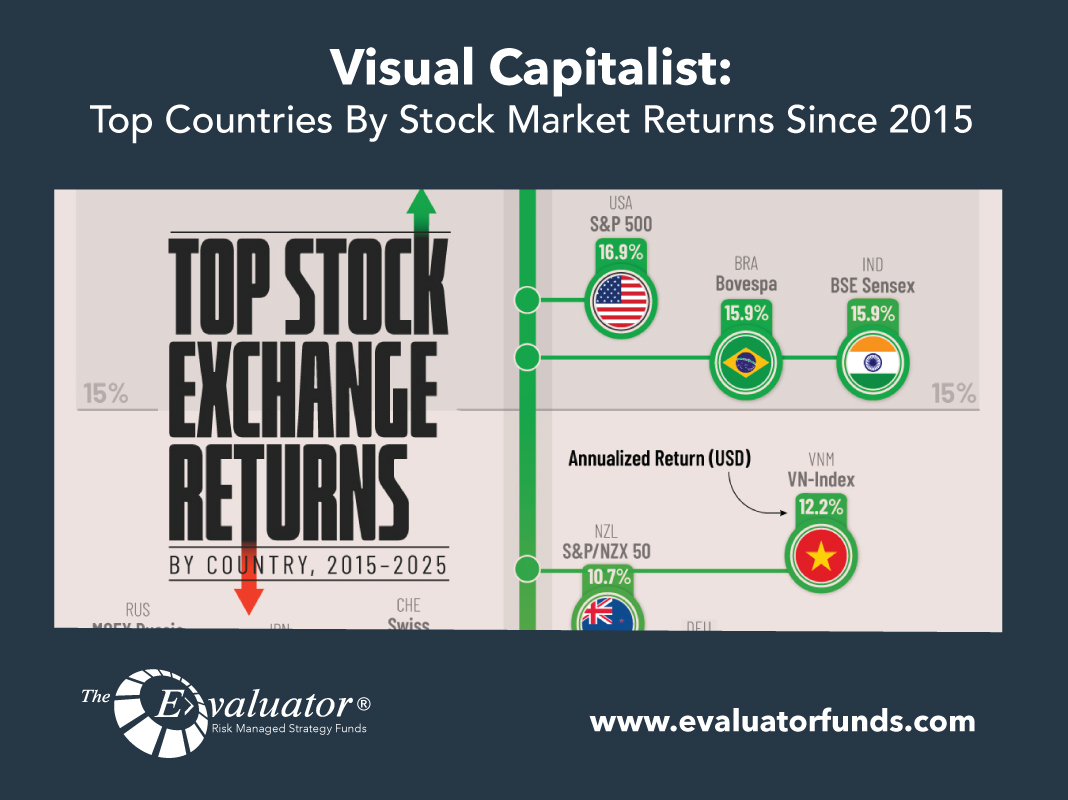
Visual Capitalist: Top Countries By Stock Market Returns Since 2015
Ranked: Top Countries by Stock Market Returns Since 2015 Key Takeaways The S&P 500 delivered a 17% annualized return in 10 years, the most for major stock exchanges from around the world. However major indices from Brazil, India, and Vietnam have also logged between 12–16% returns. Thinking of becoming a true global investor with […]
John Hancock: Weekly Market Recap Week Ended April 25
Earnings upgrade The earnings growth rate for S&P 500 companies improved as earnings season entered its busiest period. First-quarter net income was expected to rise an average of 10.1% over last year’s first quarter, based on reports already released as of Friday and analyst forecasts for companies that haven’t yet reported, according to FactSet. A […]
JP Morgan: Global Asset Allocation Views 2Q 2025
In brief U.S. growth is slowing rather than stalling; we see GDP modestly below trend by year-end, but believe the Fed has sufficient room to cut rates quickly should growth fall sharply. Policy uncertainty remains elevated with tariffs a near-term downside risk, potentially offset by upside risks from tax cuts and deregulation later in […]
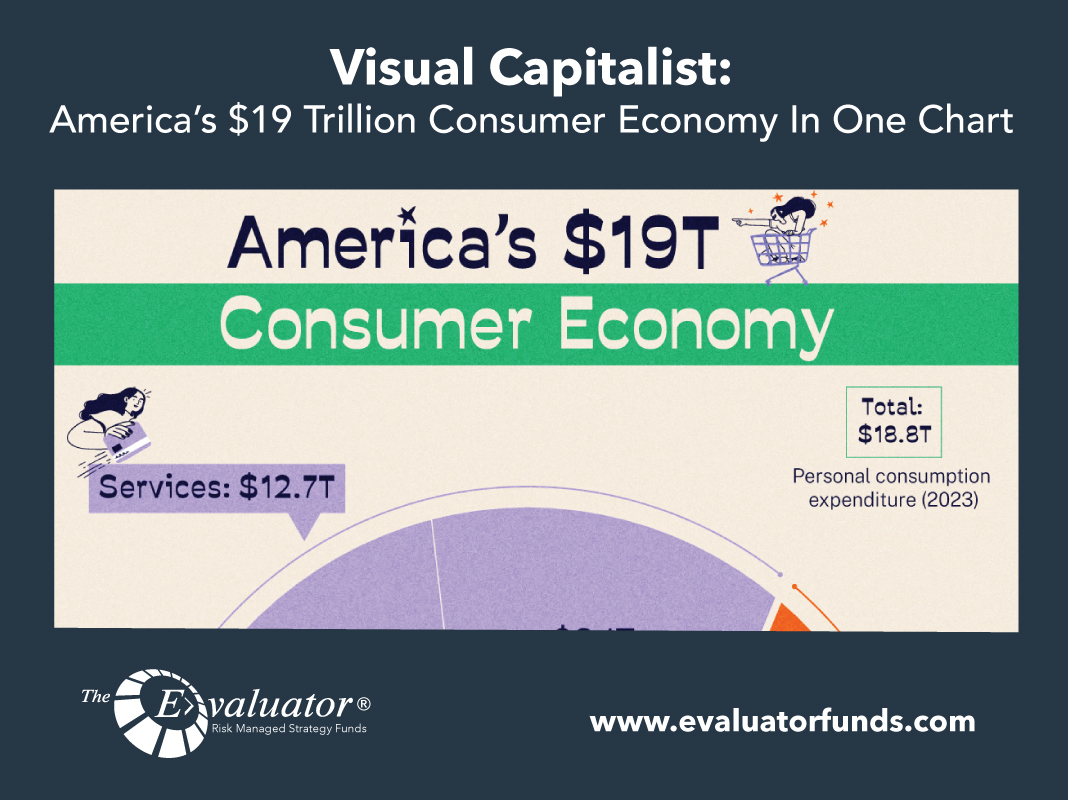
Visual Capitalist: America’s $19 Trillion Consumer Economy In One Chart
Key Takeaways America’s consumer class spent nearly $19 trillion on goods and services in 2023. Housing and utilities ($3.3T) and health care (3.1T) were the top expenditure categories overall. Americans spent the most money on groceries ($1.4$T) in the goods category. To no one’s surprise, the world’s largest economy is also the world’s […]

John Hancock: Weekly Market Recap Week Ended April 18
Dollar’s decline Amid elevated trade tensions, the U.S. dollar’s status as the world’s chief reserve currency came under renewed pressure. Its value relative to a basket of other major currencies fell for the sixth week out of the past seven, and the dollar slipped on Thursday to a three-year low, more than 8% below its […]
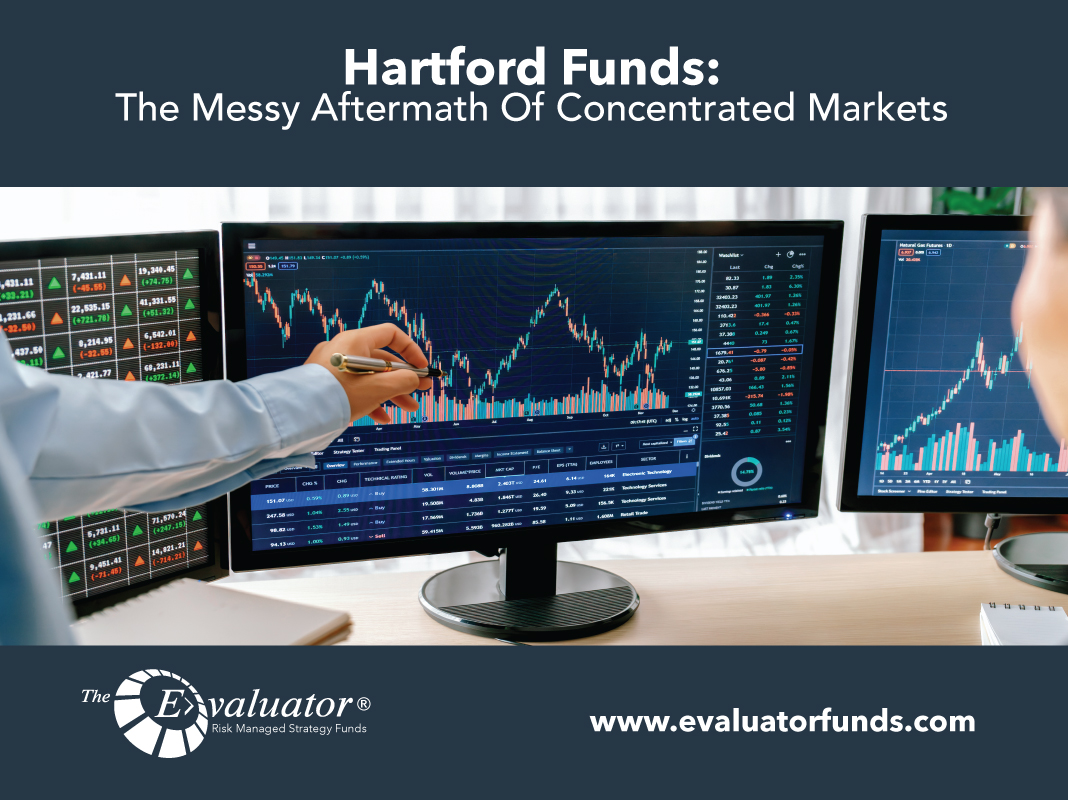
Hartford Funds: The Messy Aftermath Of Concentrated Markets
The story of concentrated markets has historically had a very unhappy ending. Our View The US stock market has reached its highest concentration level in more than 50 years, with the top 10 stocks comprising a weighting of 37.4%. While there’s always an urge to proclaim “this time is different,” market history tells us that […]
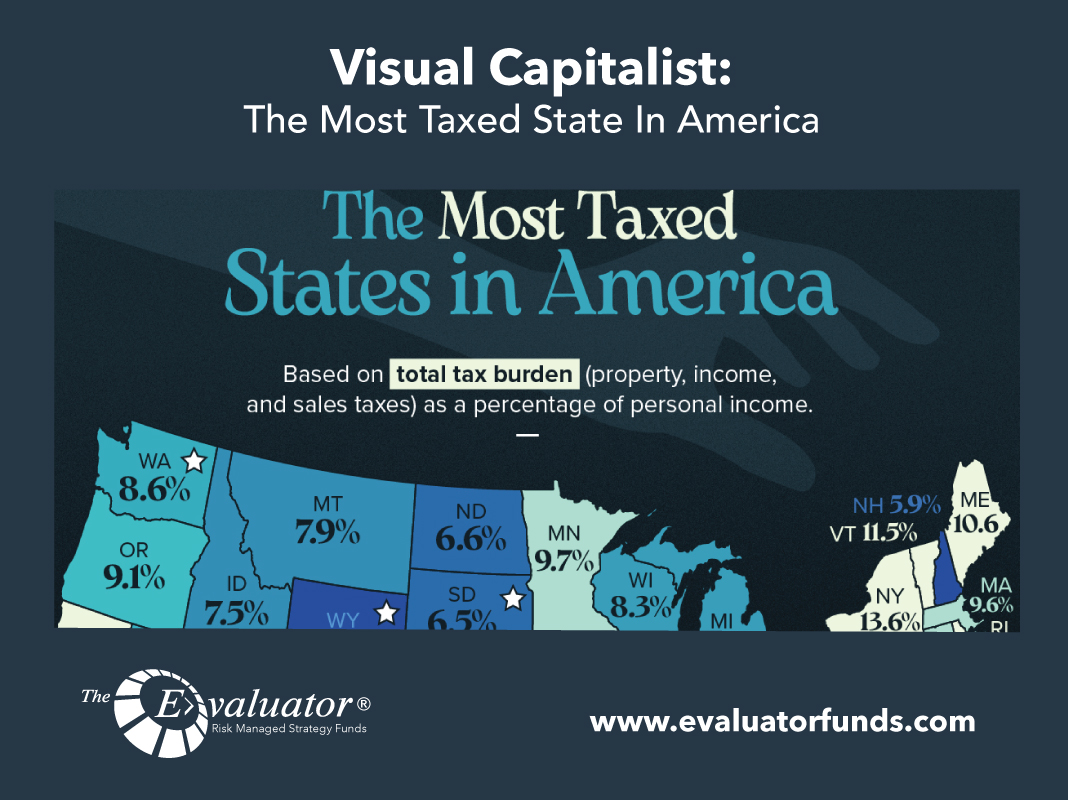
Visual Capitalist: The Most Taxed State In America
Mapped: The Most Taxed States in America Key Takeaways Hawaii has the highest overall tax burden, while Alaska has the lowest. Vermont has the highest property tax burden, […]
John Hancock: Weekly Market Recap Week Ended April 11
CPI improvement Amid concern that higher tariffs could fuel inflationary pressures in coming months, the government’s Consumer Price Index fell to the lowest level in four years. Inflation posted a 2.4% annual rate in March, down from 2.8% in February. On a month-over-month basis, prices declined 0.1%—the first such monthly decline since May 2020. […]