


Charles Schwab: Emerging Market Stocks
September 21, 2018
Key Points
- Emerging market stocks have delivered solid long-term returns but are highly volatile in the short-term; the EM index has fallen around -20% or more in seven of the past nine years only to rapidly bounce back.
- We will be watching signs closely to see if the 20% decline this year is typical volatility or something leading to a deeper and more prolonged downturn.
- These signs are: the U.S. yield curve, China’s currency, trade developments, commodity prices, economic data, and any signs of contagion in financial conditions.
Patterns of performance
After a total return of nearly 100% from mid-January of 2016 to mid-January of 2018, emerging market (EM) stocks have suffered a drop of 20% from their January high, as measured by the MSCI Emerging Markets Index. Looking back at the full 30 year history of this index we can see that this volatility has been part of a decade-long sideways trending market sometimes referred to as a “secular bear market” (to distinguish from cyclical bear markets that coincide with the end of global economic cycles). Rather than a breakout, we have seen the index return to the middle of the range for this time period.
Long-term trends for emerging market stocks
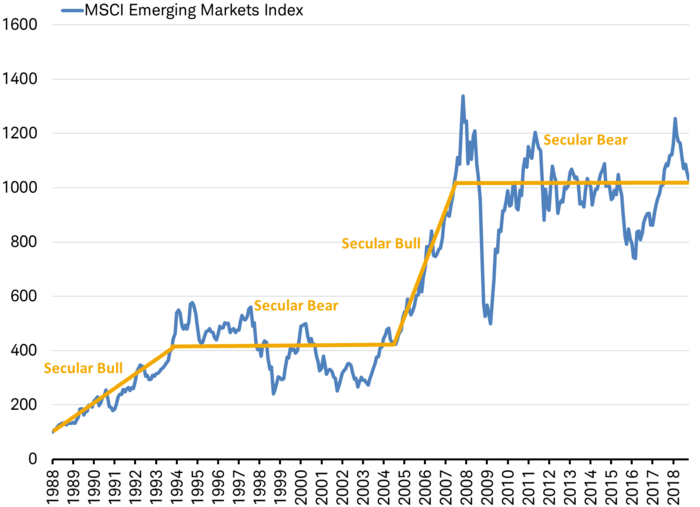
Periods labeled as secular bull or bear markets based on long-term trends since inception of MSCI Emerging Markets Index.
Source: Charles Schwab, Bloomberg data as of 9/14/18. Past performance is no guarantee of future performance.
Emerging market stocks are highly volatile in the short-term—about twice as volatile than other equity asset classes. During almost every one of the past nine years the EM index has fallen around -20% or more only to bounce back, as you can see in the chart below.
Frequent pops and drops
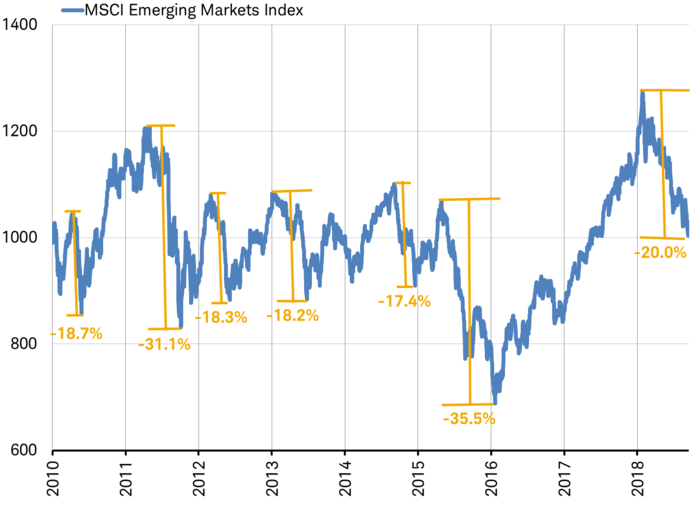
Source: Charles Schwab, Bloomberg data as of 9/14/18. Past performance is no guarantee of future performance.
With this kind of annual volatility, timing the tops and the bottoms is nearly impossible given how rapidly and frequently they happen. Looking back since the inception of the EM index we can see in the table below that once it has fallen 20%, it is usually up double-digits just six months later—unless it is the end of the global economic cycle (2000, 2008). The end-of-cycle declines have been longer and deeper.
Rapid rebounds often follow 20% declines
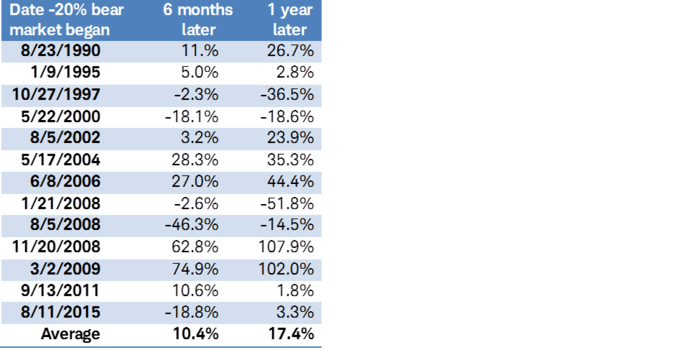
Past performance is no guarantee of future performance.
Source: Charles Schwab, Factset data as of 9/11/18.
Recent troubles
The weak emerging market economies making the news, mainly Turkey and Argentina, are struggling to fund their trade and budget deficits while managing high debt levels. However, the big EM economies of China and South Korea are nearly 10 times larger and do not share the same burdens, as you can see in the chart below. More importantly, stocks in the MSCI EM Index from the two most troubled economies amount to less than 1% while stocks from the big two make up over 45% of the index. The big two economies are largely dependent upon global growth which is why EM declines are much deeper and longer at the end of the global economic cycle.
Not all EMs share the same burdens
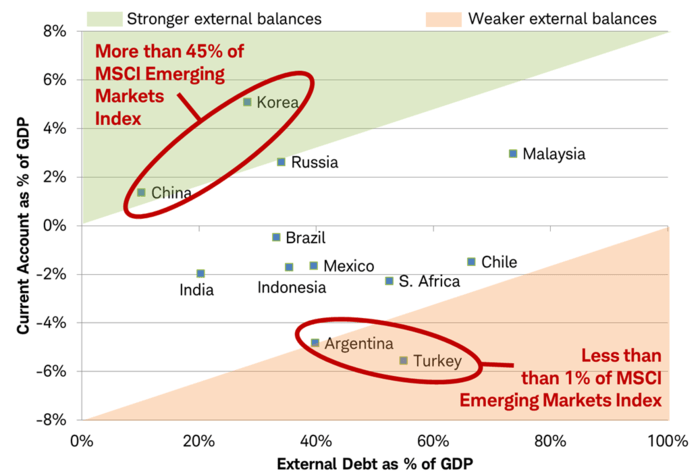
Source: Charles Schwab, International Monetary Fund and World Bank data as of July 2018.
Nevertheless, all EM stocks are being lumped together by investors as fear has gripped the market of a return to the type of environment that hobbled emerging markets in the past. Those periods include the so-called 1994 Mexican peso crisis, the 1997 Asian Contagion, and the 2013 Taper Tantrum. All three of these periods were marked by the Federal Reserve taking initial action to tighten monetary policy. Even though these mid-cycle changes in monetary policy did not invert the U.S. Treasury yield curve nor were they followed by a global or U.S. recession, the abrupt shift in monetary policy did boost the broad trade-weighted value of the dollar by about 20%. This weighed on emerging market stocks and spread rapidly, especially in 1997 due to the need for EM countries to fund wide current account deficits, support fixed exchange rates and a dependence on dollar-based financing.
In contrast, the current environment may have more in common with late-cycle environments since the Fed took initial action to end QE and raise interest rates years ago. These actions flattened the yield curve, suggesting that this economic cycle is past the mid-point and into the later stages. During late-cycle periods, the dollar has historically been balanced between competing forces. These periods saw solid (though volatile) gains by emerging markets, including the years before Fed rate hikes inverted the 10 year to 3 month yield curve in 1989, 2000, and 2006, as you can see in the table below.
Performance one year before US yield curve (10 year – 3 month) inverted
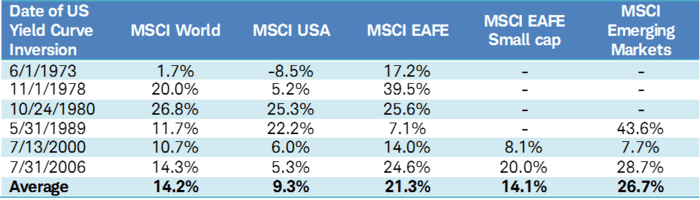
Performance presented from inception of MSCI EAFE Small Cap Index and MSCI Emerging Markets Index. Source: Charles Schwab, Bloomberg data as of 9/16/2018. Past performance is no guarantee of future performance.
The recent stability in the trade weighted dollar is a welcome relief. More importantly, ample foreign currency reserves, the lack of fixed exchange rates and balanced current accounts across many emerging markets mark key differences from 1997, lowering the likelihood of spillover from troubled EM economies to other EMs or developed markets.
What we are watching
As the global economy nears the end of the current cycle, EM stocks may suffer a prolonged downturn. To help identify these turning points, we need to continue to watch global economic indicators such as the U.S. yield curve, as detailed in the recent commentary US Bonds Have an Important Message for International Stocks.
In addition to the yield curve, below are some key drivers specific to emerging markets that we are watching to see if this year’s 20% decline has run its course or has more to go.
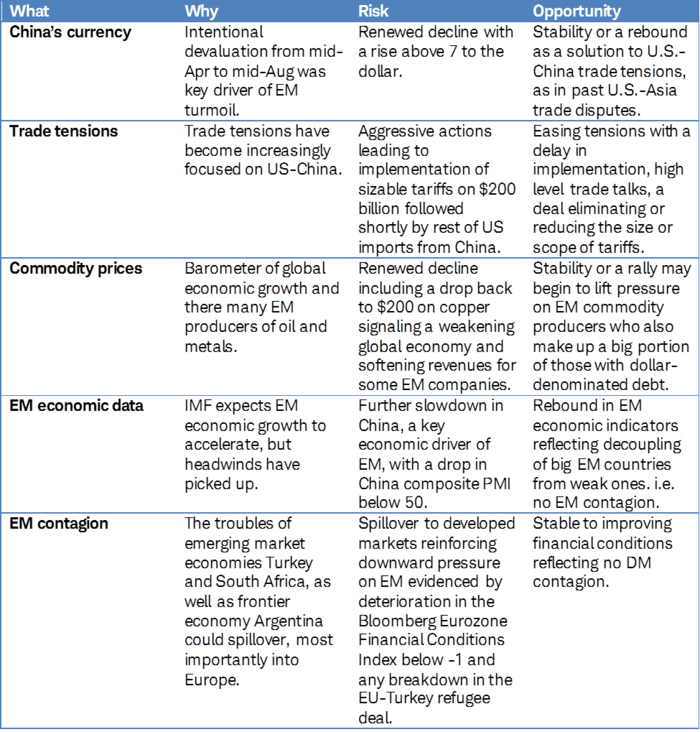
A little more discussion on each item in the above table:
China’s Currency – China’s deliberate weakening of its currency from mid-April to mid-August was a major driver of EM turmoil; while EM stocks peaked in January they didn’t begin to underperform until mid-April. Since mid-August, China has stabilized its currency relative to the U.S. dollar in an effort to cool trade escalation. This may also help stabilize EM performance and potentially lead to a rebound as the lagged effect of a weaker currency is felt in economic data. However, if the yuan breaks down again and crosses 7 to the dollar we may see further material downside for EM stocks. Stability or a rebound in the currency would likely be a positive.
Trade tensions – Markets have been bracing for the implementation of tariffs on another $200 billion in Chinese goods. In the mid-1980s and early 2000s, these U.S.-led trade conflicts with Asia were resolved with a weaker dollar which benefited EM stocks, but the past is no guarantee of future outcomes. If the U.S. implements substantial tariffs against China it would worsen the outlook. A 10% tariff on $200 billion in goods (less the existing U.S. import tariff of 3.8% on manufactured products) would be $12.4 billion or about 0.1% of China’s GDP. While this may seem small, it is difficult to determine the total economic impact. Further tariffs could prompt China to take additional actions which would likely be viewed negatively by markets. Likewise, delays in tariff implementation, scheduled trade talks, or even a deal reducing the size or scope of the tariffs would likely be welcome surprises to the markets.
Commodity prices – Relative stability in oil and more recently in gold and industrial metals, where there are a lot of EM producers, has coincided with stability in the trade-weighted dollar for the past few months. This may begin to lift pressure on EM commodity producers who also make up a big portion of those with dollar-denominated debt (given their natural hedge). We need to continue to watch commodity prices. Ongoing stability or a move higher would be good news; a drop in copper futures prices back to $200 would be a bad sign.
EM economic data – Although headwinds have picked up, the consensus economic outlook for EM is for accelerating growth and data has been coming in close to expectations in recent months. The July 2018 World Economic Outlook update from the International Monetary fund (IMF) forecasts EM GDP continuing to accelerate in 2019 to 5.1% from 4.9% in 2018. China drives a lot of EM economic momentum. China has a lot of stimulus in the pipeline in anticipation of a potential trade slowdown, including: a lower currency (by 10%), lower rates (by 200bps), and a boost to infrastructure spending. The market does not seem to be pricing in accelerating growth so a rebound in the Purchasing Managers Index (PMI) would be good news, but weakness in the data bears watching. The China composite PMI has already dropped from 53.7 in January to 52.0 in August, a drop below 50 ahead of stimulus kicking in over the coming months may lead to further declines for EM stocks.
EM contagion – We need to watch the still stable European financial conditions for any deterioration and for any breakdown in the EU-Turkey refugee deal (with political consequences for Europe) as channels of contagion from the troubles in Turkey. Signs that the markets are increasingly viewing EM countries’ problems as small and isolated may be good news. A decline in the Bloomberg Financial Conditions Index for the Eurozone below -1 could be an early sign EM concerns are spilling over into developed markets.
In addition, there are some upcoming EM events to watch including the Brazilian election in October, an upcoming IMF disbursement for Argentina, the U.S.-Mexico trade deal developments, among others that can impact EM performance.
Pop or drop
EM stocks are prone to high volatility, as we have experienced this year. Year-to-date in 2018, EM stocks have been weak with a total return of -9.3% through September 14, following a strong 37.8% total return in 2017. We will be watching the signs closely to see if this is typical volatility or something leading to a deeper and more prolonged downturn.
Source: https://www.schwab.com/resource-center/insights/content/emerging-market-stocks-what-we-are-watching