


Nuveen: A Flattening Yield Curve Doesn’t Mean A Recession Is Imminent
KEY POINTS:
- As the economic cycle advances, the yield curve is starting to flatten, usually a signal that a recession is on the horizon.
- Despite this flattening, we do not believe a recession is in the cards over the next 12 months and don’t believe the equity bull market is ending. In fact, the S&P 500 Index has historically moved higher for an average of nine months after a yield curve inversion.
- We think it makes sense for investors to approach financial markets cautiously, while sticking with a pro-growth, risk-on stance.
WHAT DOES A FLATTER YIELD CURVE MEAN?
The slope of the Treasury yield curve is normally positive, meaning that it consistently slopes upward from left to right. Longer-term bonds like the 10-year U.S. Treasury typically yield more than shorter-term bonds like the 2-year Treasury. The positive slope is generally construed as a sign that markets expect growth and inflation to strengthen. As economic cycles advance, short-term rates begin to climb as the Federal Reserve (Fed) tightens monetary policy to prevent the economy from overheating. As those short-term rates catch up to longer-term rates, the curve becomes flatter. If short-term rates exceed long-term rates, the curve is inverted, a sign that markets expect economic conditions to deteriorate in the coming years.
So far in 2018, 2-year Treasury yields have risen by 70 basis points (bps) to decade highs, while the 10-year Treasury yield has risen by just 45 bps. This makes the spread between the two the narrowest since 2007.
Are bond markets saying it is time to turn out the lights on the expansion? We don’t think
so (at least not yet). Short-term rates have already anticipated further rate hikes from the Fed over the next year, limiting the potential
for additional jumps in that part of the curve. Meanwhile, continued evidence of strong growth and higher inflation should nudge longer-term rates modestly higher, which could prevent the curve from inverting in the very near term.
But whether it happens in 2018, 2019 or beyond, the curve will eventually invert. At that point, history suggests a recession could occur within
a year or two. Importantly, though, the shape of the yield curve isn’t the only relevant economic indicator. Other signs suggest this economic expansion should continue. The Index of Leading Indicators continues to improve, consumer confidence is high and the fiscal stimulus
from lower taxes and higher federal spending continues to course through the economy.
WHAT ARE THE INVESTMENT IMPLICATIONS OF A FLATTER YIELD CURVE?
Equity markets remain well-supported by growing profits, and that should continue despite the rise in short-term rates. Following each of the past three curve inversions, the S&P 500 Index rallied for nine months or more. Bull markets have tended to end just a few quarters before the start of recessions.
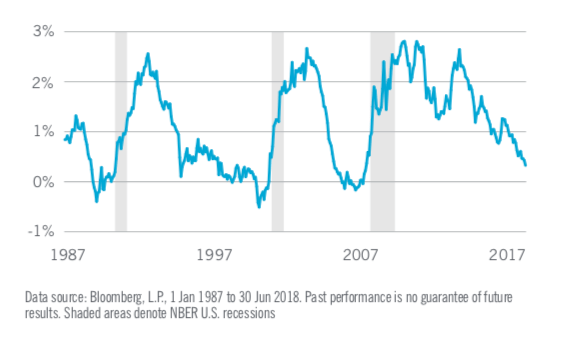
Yield curve inversions have preceded U.S. recessions by 1 or 2 years
U.S. Treasury yield spread, 2 year vs. 10 year
Taxable fixed income markets will remain sensitive to changes in Treasury yields, but investors looking to reduce exposure to rising rates, on either the short or long ends of the curve, can still find attractive opportunities in U.S. credit sectors including high yield, as well as in select emerging market debt and bank loans.
In the municipal bond market, high demand for short-term securities has kept yield curves steeper than in the Treasury market. This may allow investors to receive higher returns by moving into intermediate and longer-term municipal bonds, something they’d have more trouble doing in the Treasury market.
DEFENSIVE STRATEGIES FOR MULTI-ASSET INVESTORS
While investors concerned about a flattening yield curve need not panic, there may be things they can do to prepare for the balance of 2018 and the years ahead. In our Nuveen Midyear Outlook, (Still) Risk On, we discussed our outlook for the aging cycle and addressed the ways to invest in an expansion that is clearly long in the tooth but likely has a few good years left.
Still, we recognize some investors may be worried about the pace of curve flattening and the imminence of recession. The Nuveen Solutions team offers the following strategies for such investors who may be looking for investment strategies with the potential to reduce risk in their multi-asset portfolios:
- Growth investors can reduce equity below their typical asset allocation and, within the asset class, favor growth stocks over value.
- Income-seeking investors can reduce high yield in favor of investment grade, as the risks of lower-quality bonds tend to increase prior to protracted equity selloffs. In addition, longer-duration bonds can be good diversifiers for equity bear markets.
Sources: https://documents.nuveen.com/Documents/Nuveen/Default.aspx?fileId=74013
Index of Leading Economic Indicators: The Conference Board
Definitions
The Index of Leading Economic Indicators (LEI) is intended to predict future economic activity. Typically, three consecutive monthly LEI changes in the same direction suggest a turning point in the economy.
S&P 500® Index is a capitalization-weighted index of 500 stocks designed to measure the performance of the broad domestic economy.
This material is not intended to be a recommendation or investment advice, does not constitute a solicitation to buy or sell securities, and is not provided in a fiduciary capacity. The information provided does not take into account the specific objectives or circumstances of any particular investor, or suggest any specific course of action. Investment decisions should be made based on an investor’s objectives and circumstances and in consultation with his or her advisors.
A word on risk
This information represents the opinion of Nuveen Asset Management, LLC and is not intended to be a forecast of future events and this is no guarantee of any future result. It is not intended to provide specific advice and should not be considered investment advice of any kind. Information was obtained from third party sources which we believe to be reliable but are not guaranteed as to their accuracy or completeness. This report contains no recommendations to buy or sell specific securities or investment products. Past performance is no guarantee of future results. Investing involves risk; principal loss is possible. Debt or fixed income securities are subject to market risk, credit risk, interest rate risk, call risk, derivatives risk, dollar roll transaction risk, and income risk. As interest rates rise, bond prices fall. Non-investment-grade and unrated bonds with long maturities and durations carry heightened credit risk, liquidity risk, and potential for default. Investors should contact their tax advisor regarding the suitability of tax-exempt investments in their portfolio. If sold prior to maturity, municipal securities are subject to gain/losses based on the level of interest rates, market conditions and the credit quality of the issuer. Income may be subject to the alternative minimum tax (AMT) and/or state and local taxes, based on state of residence. Income from municipal bonds held by a portfolio could be declared taxable because of unfavorable changes in tax laws, adverse interpretations by the Internal Revenue Service or state tax authorities, or noncompliant conduct of a bond issuer.
The investment advisory services, strategies and expertise of TIAA Investments, a division of Nuveen, are provided by Teachers Advisors, LLC and TIAA-CREF Investment Management, LLC.