PGIM: The Jump In U.S. Inflation And Where It May Head Next
The highly-anticipated jump in U.S. inflation has arrived. While the sustainability of the increase remains open for debate, recent readings have surged and market-based indicators continue to show a surprisingly prolonged increase in inflation expectations. In particular, following today’s strong CPI report for April, U.S. 10-year inflation breakevens stepped up to a fresh cycle high of just under 2.6%, prompting intensified inquiries from inflation-wary clients. In response to these questions, and in the context of the ongoing inflation debate, we have not only revisited some of the findings from our earlier work on global inflation, such as the effects of central bank liquidity, rising government debt levels, and ageing demographics, but we have also examined the effect that tightening labor market conditions and other potential shocks may have on inflation looking toward 2022.
For many, the speed at which inflation has accelerated has been the most eye-catching development. Today’s U.S. CPI numbers showed core prices posting a breath-taking 0.9% increase in April, the largest gain since the early 1980s. Some of the upward moves pointed to genuine improvements in economic conditions and a return to pre-pandemic price patterns. For example, airline fares and hotel prices bounced back sharply. But other increases had the imprint of deepening bottlenecks—most notably, used car prices were up sharply as the chip shortage constrained new car production and pushed up used-car demand. On a 12-month basis, the core CPI jumped to 3%, reflecting the strong monthly readings in March and April as well as the so-called base effects from the pandemic.1
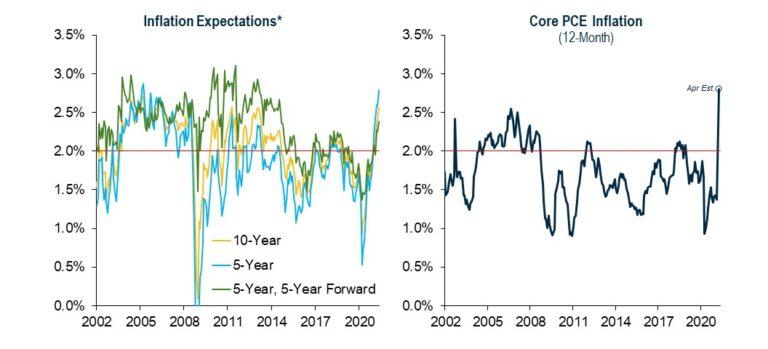
In response to these data, 10-year inflation breakevens climbed further and are now approaching pre-COVID highs, which occurred in an environment of relatively subdued inflation when the core PCE only exceeded the Fed’s target for brief periods in early 2012 and late 2018 (Figure 1). While expectations for inflation beyond five years have moved higher, the preponderance of market concern appears focused on the next several years when these measures signal sustained inflation of well over 2%. We too have marked up our inflation projections for this year, but we continue to anticipate that inflation pressures will moderate as the year progresses and, by 2022, readings will have returned to slightly below 2%, similar to the years before the pandemic.
FIGURE 1: INFLATION EXPECTATIONS HAVE BEEN HERE BEFORE IN A TEPID INFLATION ENVIRONMENT
EVERYONE’S A GARDENER
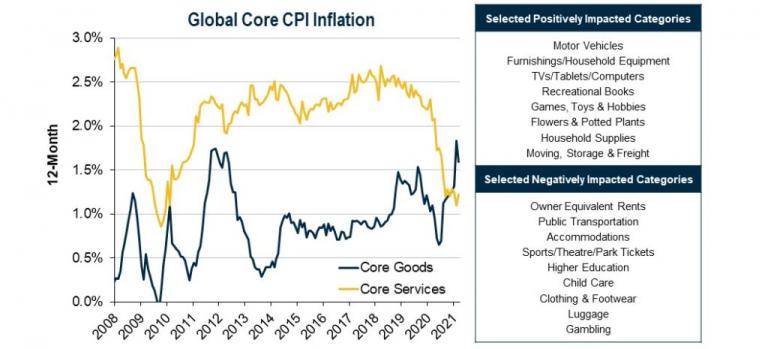
Looking at the performance of inflation through the pandemic, we interpret the data as generally reflecting shifts in relative prices, rather than to higher prices across the board. That shift clearly started with global core services (Figure 2), which were averaging pre-COVID inflation of about 2.5% and were subsequently decimated by the lockdowns. However, the relative shift also occurred in core goods as inflation in the sector rose from about 1% pre-COVID to nearly 2% during the pandemic.
The right panel of Figure 2 highlights some U.S. PCE categories where prices have been positively and negatively affected by the pandemic. The resulting breakdown is consistent with lockdown conditions—inflation for electronics, household furnishings, and flowers/potted plants rose, while inflation for sports tickets, luggage, and accommodations declined.
FIGURE 2: THE PANDEMIC LED TO A SHIFT IN RELATIVE PRICES
These abrupt shifts raise the question of how inflation will revert during the recovery. We clearly are now seeing a rebound in the demand for services that could allow their prices to bounce back fairly quickly. However, given the broad income effect and savings accumulation during the pandemic, we expect that demand for goods, including those that have performed well over the past year, will remain solid. For example, as we take further steps toward herd immunity and labor market healing gains steam, the improved circumstances should support household spending on cars, furnishings, and electronics. Over time, however, we see goods inflation returning to the more gentle pace observed before the pandemic.
STRUCTURAL RESTRAINTS
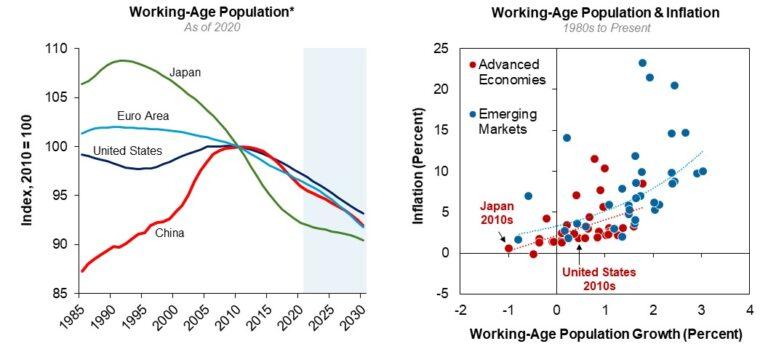
Looking further ahead, we expect several structural factors, such as ageing demographics, high global debt levels, and the onward march of technology and innovation to influence inflation in the coming years. For example, the deterioration in developed market demographic trends has occurred over decades, and we’ve found a strong relationship between the softening growth of working-age populations and declining inflation (Figure 3). More broadly, our finding that ageing demographics are associated with slower growth and weaker economic performance extends across the developed and emerging markets.
FIGURE 3A AND 3B: DECLINING WORKING-AGE POPULATIONS ARE CLOSELY RELATED TO DECLINING INFLATION
Our prior work on the labor market also ties into some frequently discussed inflation dynamics. The rapid healing in the U.S. labor market may foster concerns regarding worker shortages and potential wage inflation. The vast majority of workers who have returned to payrolls have been those who were temporarily laid off during the pandemic. Of workers who have not returned to employment, however, the preponderance have permanently lost their jobs or have left the labor force entirely. Over the past six or eight months, the return of these workers to employment has been limited and, historically, it has taken much longer for these workers to start looking for work again.
In line with these observations, the disappointing April employment report has stoked concerns that, as a practical matter, the labor market may be tighter than previously thought and that firms will need to offer higher wages to entice workers back to employment. This, in turn, could result in higher inflation. While we are watching this risk closely, our expectation is that the ongoing vaccination campaign (and improving health conditions), the further re-opening of schools, and the expiration of enhanced payments to the unemployed will allow the labor market to heal at a historically rapid pace.
The debt and money supply arguments for faster inflation will likely be with us for some time considering the scale of the monetary and fiscal stimulus implemented during the pandemic. The classical view of rising debt levels posits that increased concerns about debt-service and repayment risks can lift inflation expectations and weigh on the currency, triggering a potential inflationary pass-through into the economy. Yet, our prior work revealed a negative relationship between government debt and GDP growth—and, hence, inflation—as uncertainties regarding future taxes, debt sustainability, and anticipation of fiscal retrenchment likely contribute to slower growth.
Similarly, the classical view of increased money supply is that too much money will end up chasing too few goods, and prices will consequently rise. Yet, one of the hallmarks of the past two decades has been a sustained decline in the velocity of money in the economy. This decline may have its foundations in tightened financial regulations, falling interest rates, and disintermediation from the banking sector. In addition, rather than driving spending on goods and services, it is also possible that more of the increased money supply has found its way into the financial markets and contributed to rising asset prices in recent years.
WHERE TO FROM HERE…
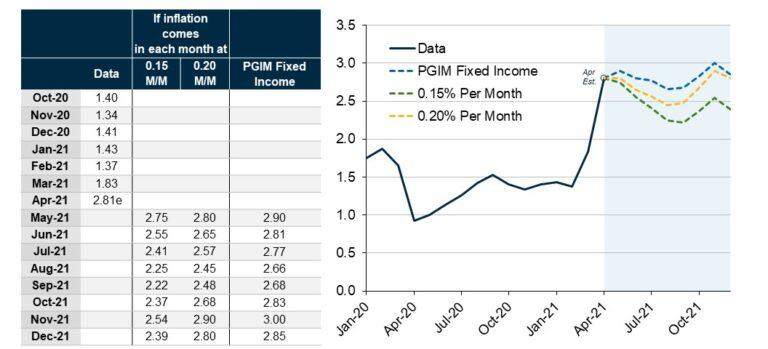
With core PCE readings having moved up sharply in recent months, the trajectory in late 2021 and into 2022—particularly as it pertains to the Fed’s 2% average inflation target—emerges as a focal question. With this in mind, Figure 4 extrapolates where varying rates of monthly price increases might place the inflation rate as the base-effect and supply-bottleneck surge starts to subside. While the 0.20% extrapolation nears 3% in late 2021, inflation should then resume a downward trajectory heading into 2022. Consistent with this, our assessment (the dashed-blue line) is that price pressures will gradually lose steam later this year and early next, as demand moderates and aggregate supply catches up. By the end of 2022, we see inflation declining to a bit below 2%, broadly consistent with its pre-pandemic performance. For its part, the Fed also appears to acknowledge the challenge of sustaining inflation of more than 2% given its projection that it will keep rates on hold through 2023.
FIGURE 4: CORE PCE INFLATION (12-MONTH, %)
The global inflation story is one that we’ll undoubtedly revisit in coming months, and we’re cognizant of the factors that could maintain inflation pressures for longer than we anticipate. Households’ savings stockpile is substantial, and its drawdown could add to the momentum as more of the country continues to reopen and additional fiscal stimulus comes through. Yet, there are mitigating factors as well—taxes may be rising on portions of the economy as fiscal and monetary stimulus eventually wanes. When these factors combine with the structural impediments to a sustainable increase in inflation, we continue to see an environment that resembles pre-COVID conditions with inflation near, or below, 2%, rather than one where the reactions to the pandemic have launched a new paradigm of consistently elevated demand for goods and services.
Source: https://www.pgim.com/investments/article/jump-us-inflation-here-where-it-may-head-next


