


Schwab: What to Watch This Year
March 15, 2019
Last year was a rough ride. Interest rate uncertainty, slowing growth and trade tensions all weighed on the markets, leaving the S&P 500® Index down 4.38% for the year.1
With all three factors still in play, we sat down with Schwab’s Chief Investment Strategist Liz Ann Sonders, Chief Global Investment Strategist Jeffrey Kleintop and Chief Fixed Income Strategist Kathy Jones in January to find out what they would be watching for in the year ahead.
Trade
Liz Ann: I believe the biggest near-term issue is trade. The tensions between China and the United States are likely to continue this year, which could continue to hurt the economy and business optimism, especially if the two sides can’t reach some sort of deal. Higher tariffs on Chinese imports act as a “tax” on U.S. corporations and put downward pressure on gross domestic product (GDP) growth. If the Trump administration were to move forward with its proposed tariffs on all Chinese imports, it could knock a full percentage point off our growth rate. And there would be ripple effects, too: Inflation could accelerate, and capital spending, profit margins, and business and investor confidence could all suffer.
Jeffrey: One positive for the markets last year was the evolution from a potential trade war between the United States and everyone else to a one-front trade battle between the United States and China. That change made the potential costs to the global economy a bit more manageable.
I think the financial health of the Chinese consumer is definitely something to watch, as well. China is a big country, and it recently made a major transition from an export-dependent economy to a consumption-driven one. To give a sense of what that means: Sales during China’s Singles Day holiday were five times what U.S. retailers saw on Black Friday in 2018. Meanwhile, Starbucks is talking about shutting down some U.S. locations, even as it plans to open 600 new storefronts in China this year.
Interest rates
Kathy: I’ve got my eyes on the yield curve—that is, the difference between short- and long-term interest rates on U.S. Treasury bonds. The curve has flattened considerably since the Federal Reserve began raising interest rates in December 2015 (see “A tale of two curves,” below).
A tale of two curves
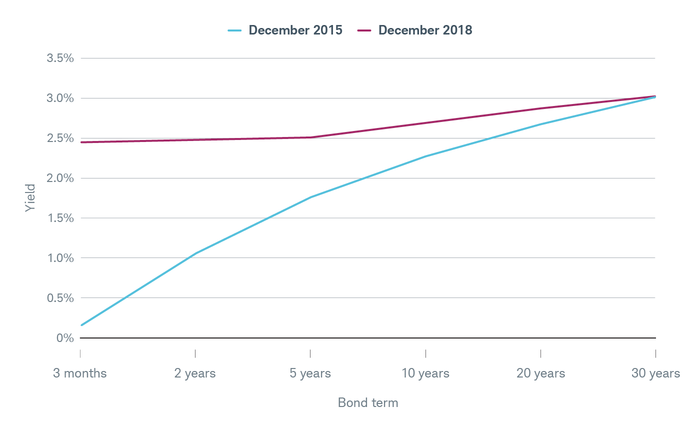
The yield curve has flattened considerably since the Federal Reserve began raising interest rates in December 2015.
Source: U.S. Treasury. Data as of 12/31/2015 and 12/31/2018. Past performance is no guarantee of future results.
It’s normal for the curve to flatten in such conditions, but as short-term rates rise relative to longer-term rates, the yield banks earn when they lend shrinks. Banks tend to borrow at very short-term rates but lend over the intermediate term. If banks’ borrowing costs rise relative to what they can earn from lending, they may pull back on lending. That can make it tougher for consumers and businesses to borrow, which tends to slow economic growth. The spread between three-month and two-year U.S. Treasuries is a particularly useful tool for tracking lending. When it narrows, that can signal there is less credit available for borrowers.
For bond investors, some slowing is good because it tends to keep inflation down, thereby boosting real yields. But it’s a fine line between a slowdown and a recession. In a recession, bonds from riskier issuers could underperform safer bonds like Treasuries.
We’ll also be closely monitoring Fed communications. Starting this year, the Fed will hold a press conference after every meeting of the Federal Open Market Committee—the group that sets interest rate policy—which should provide additional clues as to how much higher the Fed thinks rates need to go.
Liz Ann: Fed Chair Jerome Powell has made it pretty clear that stock market volatility alone won’t drive monetary policy decisions. Even so, we may need to pare down our assumptions of how much higher the Fed will take interest rates. The goal is “equilibrium”—that is, a neutral environment in which rates are neither stimulating nor restricting the economy. Some economists are still predicting two or three more rate hikes in 2019, but we believe that may be overly aggressive given the potential for slower growth, tighter financial conditions and heightened financial market volatility.
Jeffrey: Rising interest rates in the United States can have global effects. For example, emerging-market companies operating in underdeveloped local markets often borrow in U.S. dollars. When exchange rates are stable, it has little impact on these companies’ returns. But when U.S. interest rates start to rise—which often leads to a stronger dollar—it becomes more expensive for emerging-market businesses to pay their dollar-denominated debts. So, emerging-market performance may remain closely linked to the Fed’s actions in 2019.
There’s something else, too: If you look back over the past 50 years, whenever 10-year Treasury bond yields fell below three-month Treasury bill yields, it often coincided with a peak in international stocks. We’ll be watching for signs of inversion again because it has historically been a very effective signal of trouble ahead for international markets.
Corporate credit
Kathy: Corporate credit spreads are certainly on my radar. When you see the difference between Treasury yields and corporate bond yields widening, that means investors are demanding more yield from corporate bonds because they see their risk as rising. That, in turn, increases businesses’ borrowing costs.
Widening spreads are just a natural part of the economic cycle, but at some point you may start to worry about the growing risk of defaults. A lot of investment-grade bonds are now rated BBB—the bottom tier of Standard & Poor’s investment-grade scale—because the debt-rating agencies see increased risk of default.
At this point, there’s cause for concern but no reason to panic. However, if a significant portion of the BBB-rated bonds are downgraded further, that could cause prices to fall quickly. (Remember, when bond prices fall, yields rise.) The high-yield market is much smaller than the investment-grade market, so it may be difficult to find buyers if a rash of downgrades suddenly floods the market with fresh supply. Holding on to such a bond would mean living with default risk (and a potential hit to your portfolio value as bond prices tumble), while selling in such conditions could mean locking in a significant loss.
Corporate debt levels are high relative to the size of the economy, in part because companies have used leverage for stock buybacks and dividends. That said, we shouldn’t ignore the other side of the corporate balance sheet: Liquid assets have actually risen faster than debt. That could provide a cushion for corporate bonds in a downturn.
Liz Ann: The large amount of corporate debt—especially among high-yield issuers and at the lower-quality end of the investment-grade spectrum—might become a more serious issue because it could lead to a deeper recession than we might have otherwise experienced. As things stand now, the current economic cycle looks more likely to end with a shorter-term, garden-variety recession than a crisis. However, if it turns out there’s a bubble building in corporate debt and it bursts—the resulting recession could be much worse.
After all, tiny companies nobody’s heard of aren’t the only ones struggling with debt right now. The General Electrics of the world are also having a hard time. I don’t think it’s time to run for the hills yet, but there’s no question we need to keep an eye on this.
Earnings
Liz Ann: Corporate earnings are likely to slow significantly this year, especially when compared with 2018, which saw a big boost from the tax cuts. For example, corporate earnings grew about 28% in the third quarter of 2018 and likely grew more than 20% for all of 2018. In contrast, earnings growth estimates for the first three quarters of 2019 range from 6% to 8%.
Even those estimates might prove too high given the recent collapse in oil prices and the effect it’s likely to have on the energy sector and related industries. The forecasts also don’t account for last year’s strength in the U.S. dollar, which tends to reduce demand for American-made goods over time and hurt the earnings of export-oriented companies.
Leading indicators
Jeffrey: Historically, a narrowing gap between unemployment and inflation rates has been a good indicator of when a country has reached the peak of the economic cycle. When that happens, it may be a sign the economy is overheating. That was true of many of the past recessions in the United States, as well as in Japan and the U.K. Two recent exceptions were the bursting of the dot-com bubble in 2000 and the financial crisis in 2008, when the economic cycle was cut short by external forces.
The inflation and unemployment rates have been inching closer for the better part of a decade (see “Mind the gap,” below), so I’ll be paying close attention to see whether they continue their current trend.
Mind the gap
The gap between the inflation rate and the unemployment rate has narrowed before every recent recession.
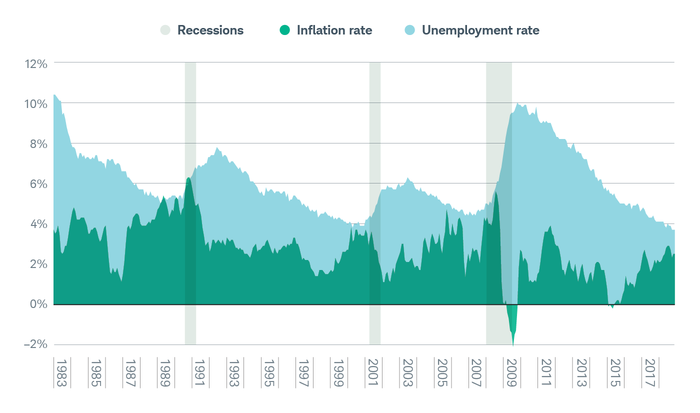
Source: Charles Schwab with data from the Department of Labor. Inflation is represented by the Consumer Price Index for All Urban Consumers (CPI-U). Unemployment is represented by the official U3 unemployment rate. Data from 01/31/1983 through 11/30/2018.
Liz Ann: When it comes to market data, I’m less interested in absolute levels than I am in the general direction or trend. For example, if we continue to see several consecutive months of rising initial unemployment claims, it could be cause for concern. The stock market has also been weaker recently.
We’re starting to see more indications that a recession may be in the offing sooner than the consensus view among market watchers. A further deterioration in the trade situation wouldn’t help.
The good news is that, on the whole, the leading indicators are still rising, albeit at a slower pace than they have recently. If the expansion continues past July 2019—and I think it will—it will be the longest in the post-WWII era. However, the risks of a recession are rising.
1Standard & Poor’s, as of 12/31/2018. Percentage reflects total returns, including interest and dividends.
Source: https://www.schwab.com/resource-center/insights/content/2019-outlook-what-to-watch-this-year